Articles by Xavier Quesada Allue

You are currently browsing Xavier Quesada Allue’s articles.

It’s finally here! After so many years of iterations, and delays due to the pandemic, I am proud to officially announce and publish the first version of Vima (formerly pre-published here as VMF or Visual Management Framework).

www.vima.cc

I hope to offer the community a real alternative to Scrum and Kanban, tailored to business teams or any environment that is a little bit chaotic in nature.

Vima is a way to bring business agility at team level into any organization. You still need to do a lot of work on mindset and culture, Vima will not work without agile leadership. But for most business teams, it is a better starting point than vanilla Scrum or Kanban and will get you off your feet faster.

Vima is not recommended as a default option for teams that do mainly innovation or product/project work. For those teams, Scrum is still the best starting point. For all other teams, try Vima.

VMF Core Patterns

#1 Calendar taskboards and date-constrained work

The most important, visible and distinguishing pattern in VMF is the integration of calendar aspects into a classic agile taskboard that allows us to visualize the time dimension when planning and executing work. Concretely, this means a VMF taskboard design will have date-related rows or columns in it instead of (or besides) a value stream, and we embrace that some tasks or PBIs will have date-related constraints.

Examples:

  • a column for each day of the week in the VMF Sprint board
  • a row or column for each sprint in the VMF Map board
  • recurring tasks
  • tasks with deadlines
  • tasks that must be done on a certain day or hour
  • dependencies that must be followed up

#2 Date-constrained empirical planning

The second pattern in VMF is the extension of empirical planning activities to include date-constrained work.

The addition of calendar-based rows or columns implies that a VMF planning session is first date-driven and second priority-driven – but without losing its empirical nature. In VMF we will take dates into account when defining a sprint or quarterly backlog.

This is in contrast to a classic Scrum planning approach which only takes into account capacity and priority, or a Kanban approach that has no planning. While we integrate dates, we maintain the empirical nature of agile planning as a core practice. This is a bit more complex than classic agile planning which is only priority-centric and slightly changes the nature of the planning practice.

In practice, this is not as difficult as it sounds. It means we start by taking into account date-constrained work, and fill in the remaining expected capacity of the sprint, quarter or release with priority work. When picking up work, date constrained work will have priority over non-date-constrained work.

#3 The VMF Map and mid-term planning

The third distinguishing pattern in VMF is the multi-track backlog, which we call the VMF Map (in honor of the User Story Map, which it resembles) and the associated mid-term refinement and planning activities. The VMF map is a two-dimensional team backlog. One dimension represents priorities and dates. The other dimension represents independent products, value streams, projects, or similar. Essentially different types of work that the team concurrently works on within the same planning window. A VMF team is a positive multi-tasking team that integrates and prioritizes work from different value streams into a delivery of maximum business value from a systemic perspective. Refinement and mid-term planning activities consist not only of classic refinement work (changing priorities, adding details, breaking down work) but also of regularly studying progress across different value streams and making strategic refinement decisions based on empirical data. For example, we might decide to descope a project or value stream from a team because the unplanned work the team has to handle exceeds initial projections.

An Agile framework for teams outside of software, IT and product development.

This is the first in a 3-part series of articles describing the Visual Management Framework (VMF), a framework for creating Agile teams outside of software, IT and product development.

Part 1: Introduction and target audience

This article is for you if you are interested in Agile, Scrum and Lean and work in/with a team that has many of the following characteristics:

  • Business team with BAU work
    • A large part of your work week consists of what is frequently called “Business as usual” (“BAU”) or operational work – somewhat repetitive, somewhat standardized activities that either constitute or support your core business and are considered value-added to your organization. The daily tasks might seem simple and repetitive to outsiders, but each task is somewhat challenging and has some risk and variation to it, as it involves dealing with people and data. It is not assembly line work.
  • Deadlines
    • Work often has time constraints: deadlines, service level agreements, “cannot start before” date, “has to be done exactly at that day/hour”, etc. This means it is not enough to focus purely on priorities.
  • Recurring work
    • There are recurring activities that need to be done regularly, otherwise things stop running smoothly and failure demand is created.
  • Multiple types of work (multiple value streams)
    • There are different types of activities that have to be dealt with within your team. Often, these value streams are not universally prioritizable (i.e. it is not the case that “work type A” always has precedence over “work type B”)
  • Projects
    • Your team is also expected to contribute to or deliver projects of different nature. Some of them are internal improvement projects coming from and benefiting mainly your team. Some are bigger or external projects where you are involved as a stakeholder, part time project team member, subject matter expert, etc. Often you are expected to work on multiple projects in parallel.
  • Dependencies
    • Both your BAU and project work often involve interacting with 3rd parties outside your team, creating dependencies which involve waiting periods and follow-up activities. These dependencies cannot be eliminated (at least not in the short term) due to multiple reasons (e.g. logistical, economic, technical, HR, political, legal/compliance, etc.).
  • Emergencies
    • You also need to frequently respond to urgent requests from a variety of sources: customers, management, incidents, etc.

Your typical work week is a big mix of scheduled tasks, high priority work, recurring work, urgent-important stuff, firefighting, working on multiple projects at the same time, multitasking, context switching… This scenario can quickly lead to stress, chaos, and the feeling that you are overwhelmed and the situation is not under control.

Symptoms might include:

  • No clear priorities You cannot reliably answer if you are working on the most important, most valuable things right now – there is too much on your plate. It feels everything you get to work on is urgent and important. You do not trust your prioritization process, or you don’t have one, or you have one but you don’t have enough time to apply it to classify and prioritize the work. You are not able to effectively balance long-term and short-term work.
  • Forgetting stuff Too often you forget to follow up on something, or to do a task. This creates failure demand.
  • Lack of project visibility You do not have good visibility on project progress. You are typically unable to forecast a delivery date for projects or give warning if you are falling behind.
  • Lack of trust from leadership This creates a feeling among leadership that projects involving your team never get done, or don’t get done fast enough – and that your team is not reliable.
  • Overworked You have the feeling the team is overloaded with work beyond its capacity, but you cannot prove it.
  • Not a real team You might also have the feeling you are not a very effective team in general. You see opportunities for improvement regarding communication, collaboration, self-organization, shared purpose feeling, etc. If you have a leadership position within the team, you might feel you are micromanaging and burning out and not getting the results you hope for.

You might have heard of the benefits Agile methods have brought to the world of software development, IT, and product development in general. Maybe you have already dipped your toes in the agile waters, reading a book or taking a foundations training such as the Certified ScrumMaster from the Scrum Alliance. And you might have found that while the general message resonates and motivates you, most of the examples are IT-related and some of the learning objectives and practices are very IT specific – they don’t seem to fully cover or understand the reality of your team. You are looking for an Agile approach that embraces and works with the full scope of your team’s work, instead of fighting or ignoring it. Unfortunately, this approach doesn’t exist (yet)!

In large organizations there are a number of teams or departments that typically meet these criteria. Examples include HR teams, Marketing, Sales, Customer Service, Finance & Accounting, Quality Assurance, senior leadership (ExCo) and often also operational teams doing core business activities.

In small & medium companies the trend is even stronger, as there is a need for more cross-functionality and T-shaping. Admin departments and most operational teams from medium and small service organizations tend to meet the criteria. There are dozens of other examples across all industries, size and type of organizations.

It is actually easier to summarize the type of teams that do not fit these criteria. Teams that do not fit these criteria usually fall into one of these two categories:

  • Dedicated product development teams that do primarily innovation work and are focused on one thing (software development teams, dedicated project teams, etc.)
  • Teams that do primarily highly standardized, highly repetitive or highly unplannable work (factory teams working the assembly line, call center teams, emergency response teams, etc.).

For all the rest, the Visual Management framework (VMF) is probably of interest.

Part 2 of this article series will describe the core practices and patterns that constitute the framework.

Part 3 will describe some case studies and examples of the framework in practice.

Joke and I will be presenting our patterns for working with time-constrained work (deadlines, delegated work, recurring work, etc.) in an agile way at the London Scrum Gathering today. We’re calling it the “Visual Management” framework. Stay tuned for more information including slides and extra content on this blog after the presentation is over.

Xavier

Building a taskboard using a laser guide

Building a taskboard using a laser guide

Here’s a high tech and original way of building a physical taskboard. (source: Agilar team @ Belgacom)


Samir Hanna is a ScrumMaster at F-Secure in Bordeaux. He and his team felt they needed to improve their taskboard.

“The board is the mirror of the team’s daily work. The board was a mess… You could not see anything, everything was confusing… You can’t have clean water coming from a dirty pipe.”

He wrote an e-mail to the Agile Games mailing list asking for a suggestion and was referred to the Visual Management workshop I ran at Agile 2009 in Chicago. Read Samir’s account on how he ran the workshop within his team, with great results. Nice taskboard Samir! I particularly like the small pictures and the status tags. And of course the gun.

Team Calendar

How does a self-managed and self-organized team coordinate holidays and other planned absences? It doesn’t need to be more complicated than a Team Calendar. Print a blank monthly calendar on an A4 sheet of paper (you can do this from Outlook, or if you want to go fancy, Visio) and put it on the taskboard. Team members write their name on the days they will be out of office.

(Click to zoom on the pictures) The team calendar is also a good place to write down any team events, indicate start and end of sprints, etc. This closeup of the calendar below shows which 2-week sprints the team will be doing during the month. It also indicates the day they demo and plan (every two mondays) and there is a national holiday indicated by the little island icon.

As you approach the end of the month, you probably want to put up next month’s calendar on the board, at the same time as the current month.

Visual Management for having a baby

Hello! I am Laura Quesada Allue. I was born in January 2010. Maybe you were wondering why my daddy hasn’t written anything on this blog for the last 8 months? Well, now you know!

This blog post tells the story of how my parents used Visual Management to coordinate the tough project of preparing themselves for my coming to the world. I leave you with them now…

Project initiation

When we learned we were going to be parents, the first thing we did was to think about the main characteristics and constraints of this project.

  • There were two main tracks. One had to do with making sure the pregnancy and delivery went well. Tasks in this track were for example periodic visits to the doctor, finding a good hospital, etc. This track was high priority and almost all tasks were “must have”.
  • The other track dealt mostly with things we needed to get ready before the baby was born, such as the baby room, the baby card, having enough clothes, the Maxi-Cosi, etc. Tasks in this track were spread all over from “must have” to “nice to have” so they were very good candidates for prioritization.
  • We can think of the customer of the project as Laura, and the team as us the parents. Other stakeholders included the doctors, family and friends.
  • This project was going live no matter what. Like the Olympics, you can’t change the date one month before launch just because you’re not making it! An interesting note is that we didn’t know the exact go live date, we only had a range. We would be told the exact launch date by the customer (Laura) with aprox. 24hs of anticipation :). So we had to be ready with all must-have functionality by the earliest possible launch date.
  • For some tasks the acceptance criteria was very negotiable. For example: buying a crib was a must-have. But that the crib should be the coolest crib on earth was nice-to-have. ‘Coolest on earth’ was part of the negotiable acceptance criteria of that story.
  • Some tasks had to happen at a certain fixed date, others were flexible. Typical fixed-date tasks were doctor’s appointments for example.
  • The team members (us, the parents) were not working full time on the project. This means that at certain moments, if necessary, we could scale up our efforts on this project to the detriment of other parallel projects we were doing (for example searching for a house, or our day jobs).
  • We wanted to delay doing things until the last responsible moment, but we also wanted to do things at a sustainable pace.  The challenge was to balance our workload evenly.

Based on these characteristics, we chose the following Visual Management strategy:

  1. Since the project was time driven, we would build a physical taskboard that visually represented the project timeline.
  2. We would populate the board with tasks and metadata (important information we had about the project).
  3. Tasks would have a different color based on their nature: orange for normal tasks, pink for fixed-date tasks (appointments), blue for special events such as Agile conferences or other travel.
  4. The pink and blue tasks were fixed on the timeline by their nature. The orange tasks could be moved around. We would balance the load by changing the position of orange tasks so as to spread work evenly throughout the project.
  5. What to do with tasks that got done? First we thought on crossing them out and keeping them there, but we quickly learned that it was visually confusing. So finished tasks would be removed from the board.

Building the taskboard

Note: you can click on all the pictures for a high-resolution version.

The timeline represents the 9 months of pregnancy (blue lines) and the first 3 months of Laura’s life (green line). We didn’t know if we would need the green line, but we had space left over so we put it in anyways.

We wanted to visualize calendar months and pregnancy weeks at the same time, because certain tasks or events are commonly associated with the week number, while months gave us the big picture.

A detail of months and weeks. What you see in blue is all electrical tape.

We got these cute clip magnets at XP Days Benelux; they would come in handy.

Running the project

This is how the board looked when we got started, in week 5 (June 2009). The board was populated with all tasks and information we had at the moment: our initial planning. We adorned the board with some cute baby-themed magnets we got from cousin Flo. Tufte would not like them, they were pure decoration.

Once the project got underway, the following activities were typical:

  • We would remove post-its (tasks) as they got done.
  • We would add new tasks as new requirements came up.
  • Sometimes big tasks got broken up into smaller ones, or one task being completed triggered more to be created down the line.
  • We would re-prioritize tasks if they were not done by the original planned date.
  • Reports generated by the project, for example the ultrasounds (ecografías), were placed on the timeline.
  • Any other relevant information was either stuck on the board with magnets or written with whiteboard marker.

We would regularly make small improvements to the board. For example we added a green “you are here” arrow. Some people asked us what the board was about, so we added the title “Baby Board”.

The board was both an effective planning tool for the future, and a living recount of the past.

You can see that as the green arrow moves along, the post-its disappear with it. The fact that post-its were not accumulating further down the line meant we were proceeding at a good pace. If we would notice a cluster of orange tasks accumulating, we would know we were behind schedule and would react by putting in more time, or dropping requirements.

Finally the date was approaching! We knew the project would be a success because almost all our tasks were done.

Going live

The release to production took 11 hours, and was quite tough for one of the team members (guess which one)… but eventually it was successful and the project went -very literally- live. Welcome, Laura!

In Belgium, people exchange cards when a baby is born. As cards started to arrive, we put them on the taskboard, turning it into a “celebration” board.

At the end, we almost didn’t have enough room! One of the best cards we got was a mini-taskboard baby card from one of the teams we coached. Thanks guys!

To close, a big smile from Laurita dedicated to all the friends in the international Agile community. Isn’t she cute?

Status tags revisited

Status tags are my preferred approach to visually attaching state metadata to work items.

In plain english, what this means is that if you have a task, represented for example by a standard size Post-it, you would add a physical tag, represented by a smaller colored Post-it, to indicate it has some particular status, such as “Blocked” or “Delegated” or “Bug” or “Please Test”. This creates visibility and awareness and enables the right people to react to that new status fast.

A visual alternative to tagging is creating special columns or specially designated areas in your taskboard that fulfill the same purpose.

While this is valid, and many people do it, I much prefer tagging to that approach. Taskboard real estate is expensive. If you start creating special areas or columns for each status a piece of work can have, you might quickly fill your Taskboard with empty zones. Furthermore, changing the structure of your taskboard is cumbersome. This might limit the number of status areas you create. Too many areas and columns make people think about waterfall processes, even if they are not meant to be used. For example, look at the picture of the following kanban board:

While it looks good because it was done with care, there is much wasted space in those columns and boxes. And let’s take a closer look at those separate areas at the right. In this example we see a “Back to business” box. What if this status is very temporary? In that case, you are probably better off tagging it. Creating the box has allowed work to accumulate there, unchecked. Are all those post-its supposed to be going back to the main board? Someone is going to be spending some serious time moving post-its back and forth…

Another example: let’s assume a task that involves coding but is functionally testeable is being developed. During the same day the following happens:

  • A developer starts and finishes it
  • Someone else tests it and finds a bug
  • The original developer fixes the bug
  • The task is re-tested and this time declared “done”.

This is a typical scenario in Agile teams. If you have separate columns for “In development”, “To validate”, “Defect found”, you are going to spend the whole day moving the task around columns. People might lose track of where the task went (well, not really – but it does require more effort to locate it). I prefer the much simpler solution of leaving the task in place and rotating status tags on top of it. Another advantage: if it would go through this code-test-bug-fix cycle many times, you can place status tags on top of others, creating a “traceability” effect. With columns, you can’t do that.

Tagging is very flexible. There is no limit to the number of tags you can create. Some teams create temporary tags for special occasions. In the example above, the tag “checked” was created specifically for the occasion. This can be done quickly and easily by the team by their own initiative. Almost no work is required and suddenly your visual management process includes a new status.

I think the elegance, flexibility and visual appeal of using colored tags for indicating task status cannot be denied. Even in a software tool, it looks good, as the example below shows.

For physical taskboards, my preferred tags are Post-it 653 which come in many different colors. They are the 1.5″x 2″ small ones.

Important detail: if you just stick this small post-it onto a bigger one, it will not stick, it will fall off almost instantly. That’s why I use a small piece of Scotch Magic tape with each status tag. See the first picture in this post for a detail.

Build a taskboard in 10 steps

In this tutorial I will explain how to build a physical taskboard out of electrical tape step by step, for those of you who -like me- were not born with a gift for bricolage. I admit up front to this post not being my most intellectual piece of work ever, but I’m hopeful more than one of you out there will find it at least marginally useful.

I will demonstrate using a 120 x 90 cm whiteboard, the smallest format that will support a small team board. Magnetic whiteboards make great task boards because the surface is so versatile: you can write on it, you can stick magnets, post-its stick and unstick very cleanly, so does Scotch Magic tape, and -most important for this case- so does electrical tape, which is what we will be using to make the lines. That means that if you make a mistake, you can just unstick and re-stick the tape, though it will never be as easy as the first time around. The downside, of course, is that they are expensive and/or not always available for hijacking in your office. That’s why I advocate building boards wherever you can: I have built boards on the back of closets, directly on walls, and even on windows (looks cool at first, but later it’s very distracting – your attention always ends up going to what’s outside).

What you will need:

  • 1 ruler
  • 1 roll of electrical tape
  • 1 whiteboard marker
  • 1 pair of scissors

Note: if you don’t have a whiteboard, electrical tape might ruin your surface (for example it might peel off low quality wall paint). A good alternative is thin blue painter’s masking tape.

Step 1: This is how our whiteboard looks before starting. If you did not buy a new board, make sure it is clean of any old whiteboard marker ink, old pieces of scotch tape, etc.

Step 2: Make two small marks at 25 cm from the left side of the board, one should be around 5 cm from the top, the other almost at the bottom.

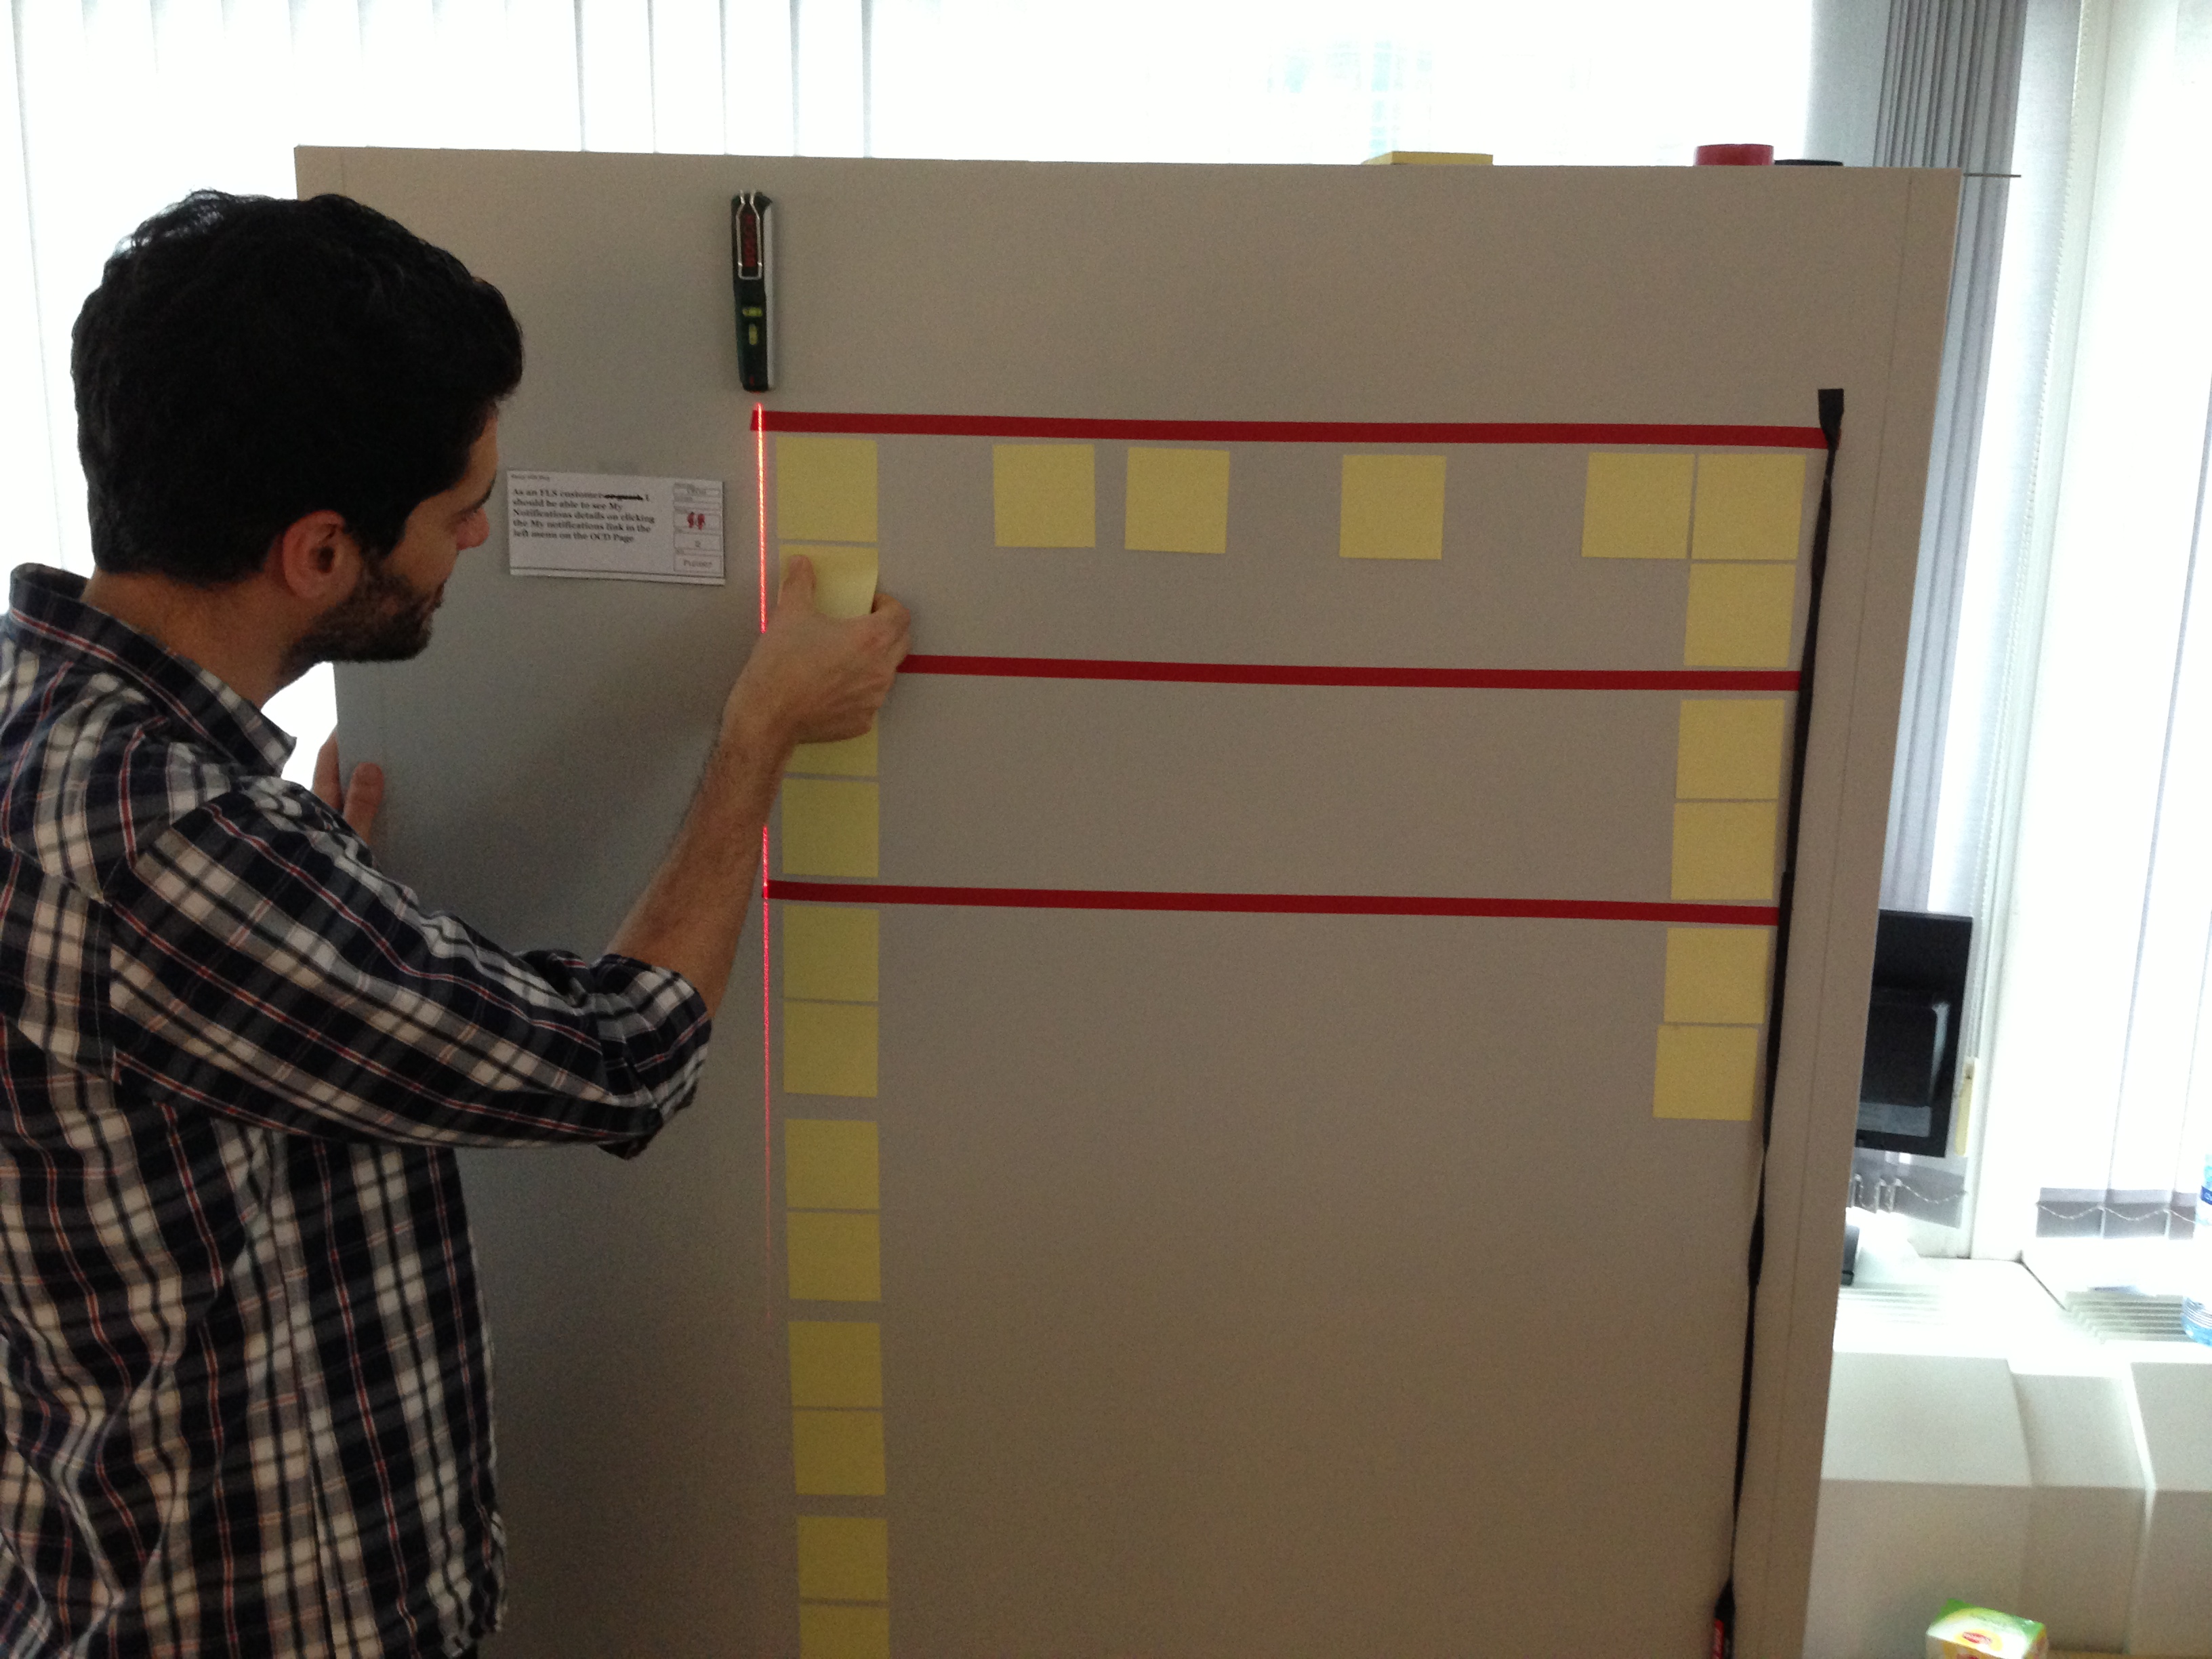
Step 3: Press the tip of the tape with your thumb on the top mark.

Step 4: Carefully extend the tape out and downwards, without touching the board, making sure you do not pull too hard on the tape. Electrical tape is elastic, and if you pull, you will stretch it and stick it in a stretched state. Later on it will contract to its original length, unsticking and curling upwards, ruining all your great effort. (It took me several cases of shouting “Who sabotaged my taskboard!” in vain to figure this out)

Step 5: With the tape still only touching the board at the point pressed by your thumb, carefully bring down the roll of tape onto the bottom point.The full roll should be resting on the bottom dot. The tape will now be touching the board but only lightly.

Step 6: Carefully pass your thumb upwards over the entire tape, which should stick cleanly and nicely to the board.

Step 7: Cut the tape at the bottom and voilá, you should have a perfect line.

Step 8: Repeat 3 more times, each line 25 cm from the one before it. You should now have 4 vertical lines.

Step 9: The horizontal lines should be placed in a similar way. First put the bottom line on the bottom of the board. Then measure upwards at distances of 15 cm. You should be able to place 6 lines.

Step 10: Add any additional sections you wish in a similar fashion. Then add little signs for the columns, status tags, nametags, team pictures, and you are ready to start scrumming!

For the electrical tape, I recommend 3M Temflex 1500. This tape is cheap and high quality and in Belgium can be purchased at the Brico for less than 1 euro the roll. Look for these packages of 10 rolls if you are going to build multiple boards for different teams: you get all kinds of colors.

« Older entries