Great video!
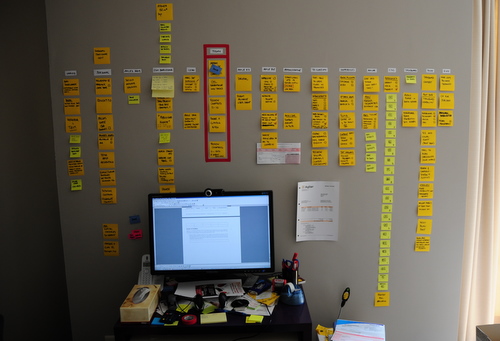
Any similarity between this guy and my desk is purely… frightening. I hope these things don’t start moving on their own!

Using information visualization to manage agile projects
You are currently browsing the monthly archive for June 2009.
Great video!
Any similarity between this guy and my desk is purely… frightening. I hope these things don’t start moving on their own!

Here are some examples of Kanban boards I built for a friend. I was not coaching these teams, so I did not have any say on the process. My job was simply to build a board that would reflect their current process, using my Visual Management guidelines.
These boards are for a corporate unit that acts as a sort of “enterprise proxy product owner”. They receive business demands from multiple business units, they analyze and classify them, and make a proposal to the customer. They also make recommendations such as build or buy. If the proposal is approved, they send it to development and follow it up into production.
For my first attempt, I was told that there was a special state that had to be highlighted: the “GO/NO GO” state, where a proposal is waiting to be either approved or rejected. So I built this board with a red swimlane to hold kanban cards in that state:
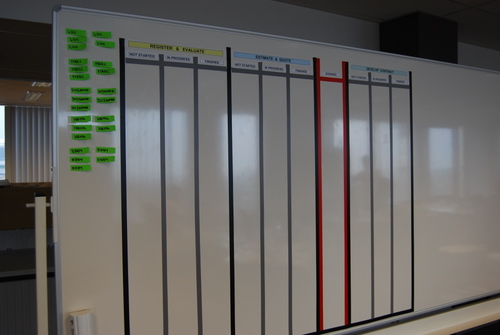
I was very happy with this solution from the visual point of view. Unfortunately they realized that it did not reflect their process accurately so I was asked to tear it down and start over again.
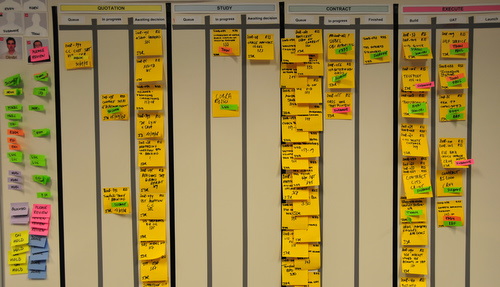
For the next iteration, They identified four states where something vaguely resembling single-piece-flow should theoretically occur. The four states are “quotation” (yellow) , “study” (blue), “contract” (green) and “execute” (red). The colors are the background color I chose as a title for the swimlane to visually distinguish it. For each state, there are three sub-states that are not always the same. This is what a finished board looked like:
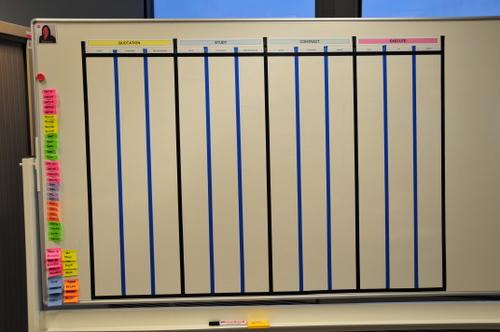
Note that I used different colored tape to indicate internal columns from state-boundary columns. In the first board I had used gray tape, which I like more than the blue tape in this picture because it connotes better the idea of sub-columns.
These boards were accepted and populated with kanban cards. Each card is a Super Sticky Post-It, representing a customer demand as it flows from being submitted by the business to being deployed into production. Note how immediately upon populating the board the bottlenecks became visible. This board represent the initial state this team was in when they decided to visualize their workflow.
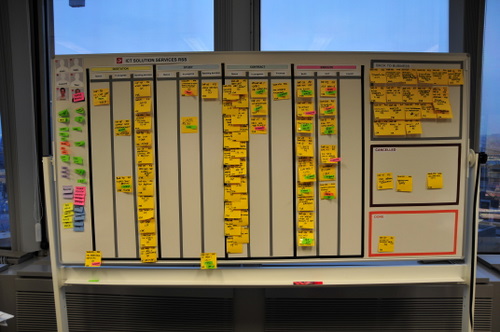
They also put some sections out of the swimlanes for special things. For example jobs that get cancelled or sent back to the business. Those are the boxes you see on the side.
Here is a closeup of the main part of the board.
Recent Comments